Turning Data into Executive Action
Insights and analysis to help leaders make better decisions, faster
Using data now
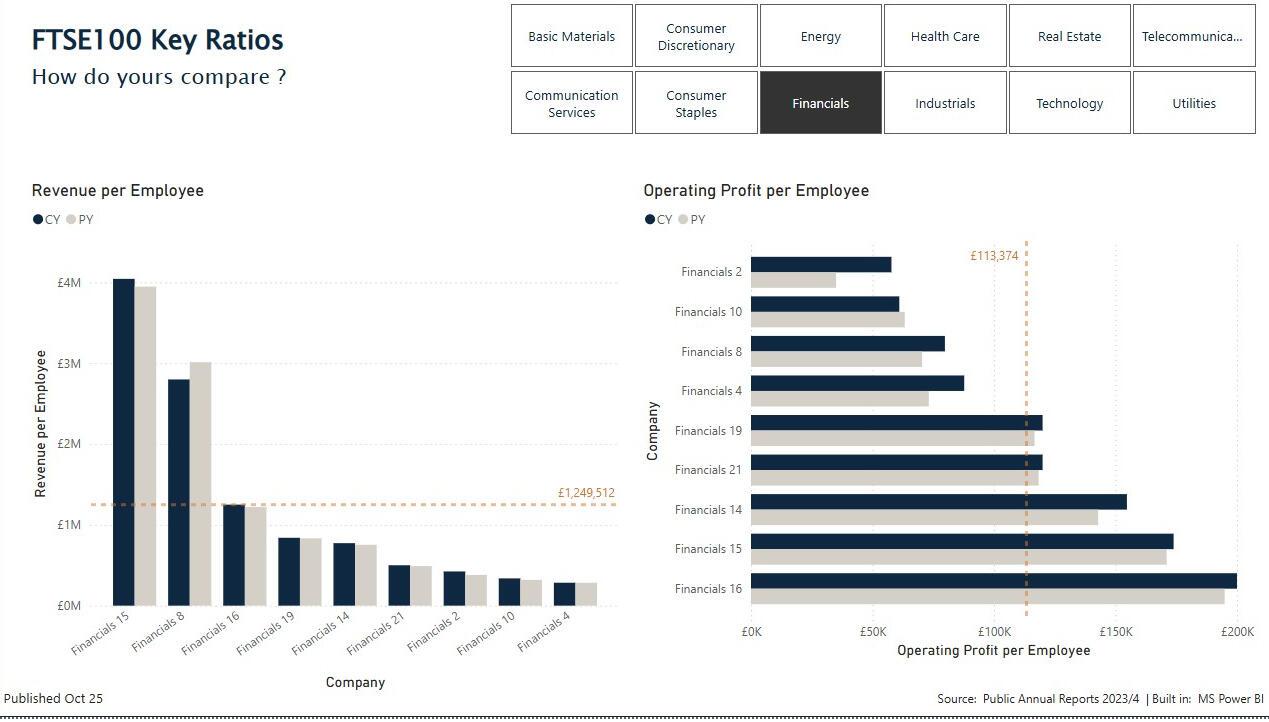
Data is available. But is it being used in your organisation effectively to inform decisions ?These simple charts show 2 key ratios: Revenue per Employee and Operating Profit per employee and in this case, show comparisons between companies in the same FTSE100 Financials sector.Profitability | Efficiency | Liquidity | Gearing


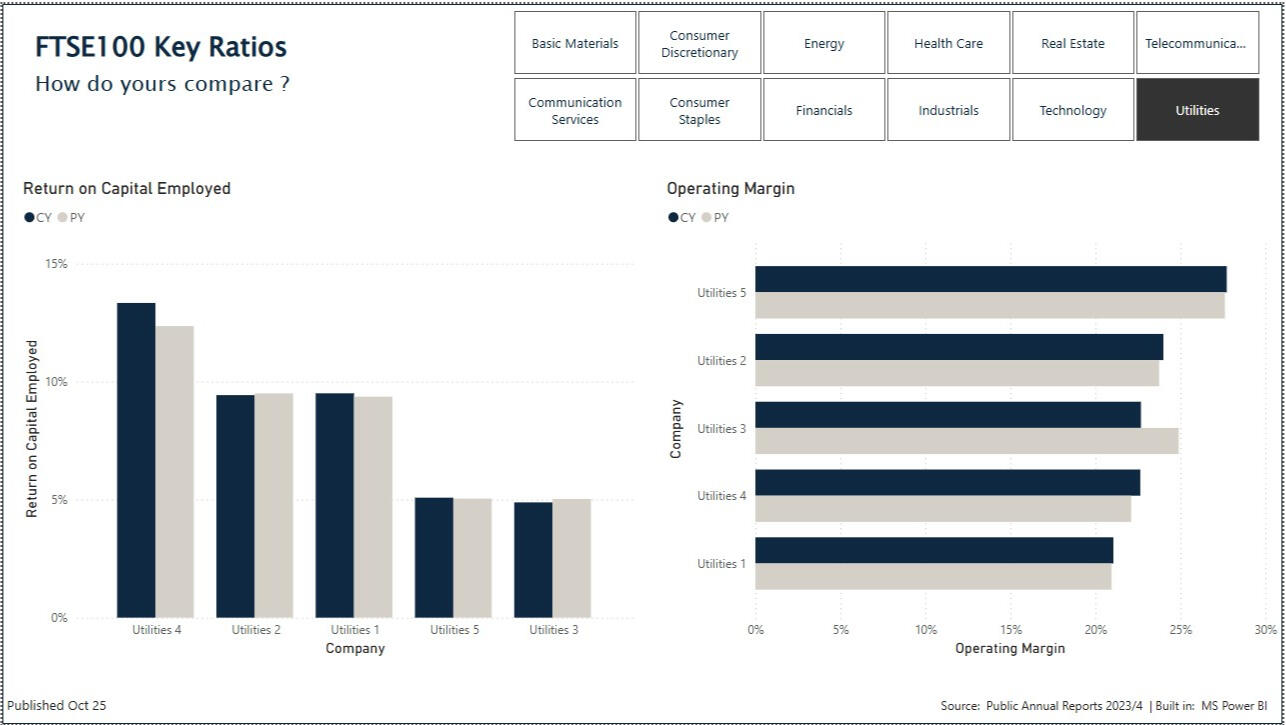
These charts use similarly availlable public data to calculate 2 profitability ratios: Return on Capital Employed and Operating Margin in this case, showing comparisons between companies in the same FTSE100 Utilities sector.Profitability | Efficiency | Liquidity | Gearing
Is there appetite in your organisation for looking beyond what must be looked at, and what can be looked at, to drive better performance ?